February 7, 2015
#Blogging 201: Site Stats & Archives
Statistically speaking, I have only ever looked at my stats on a not-so-regular basis averaging at only once every few months. It’s not quite something I’m obsessed about, mainly because I know that prior to #Blogging 101, the traffic has been nothing but pathetic.
Besides, given that part of my job does require me to look at stats and analyse them (which can be quite fun sometimes, other times really time-consuming and leading to analysis paralysis), looking at stats is akin to work for me; not something I want to associate my love for blogging to work!
The recent #Blogging 201 assignment of diving into stats to learn more about what my readers love, however, had me navigating through my stats after months of hiatus. I spent a good few hours intermittently over several days (I keep getting distracted!), trying to make sense of things.
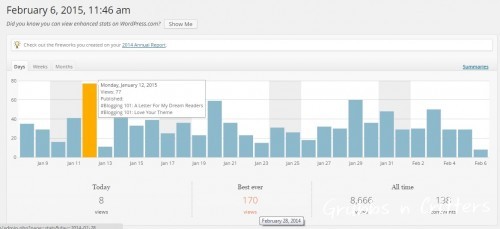
Getting into #Blogging 101 certainly has helped with my traffic count, and although my All Time views peaked to over a whopping 8,600 views, this had been a cumulative views from blogging that had spanned over several years. Is that good? I honestly don’t know. Good is relative and I am not one to obsess over numbers.
What was interesting is that my Best View peaked at 170 and this was done over a single day sometime last year. The posts read had seemed random, but I know better: Someone sinister, unbeknownst to me then, had been obsessively stalking my life and continuously zooming into pictures of me and my husband. A crazy maniac, a devil personified, bitter sod who had been persistent to leave their evil footprints just so they could ruin the lives of other people. Sounds creepy isn’t it? It’s true.
But I digress. I was talking about stats relating to Blogging 201 assignment. Boring stuff, unless you have a penchant for stats and numbers.

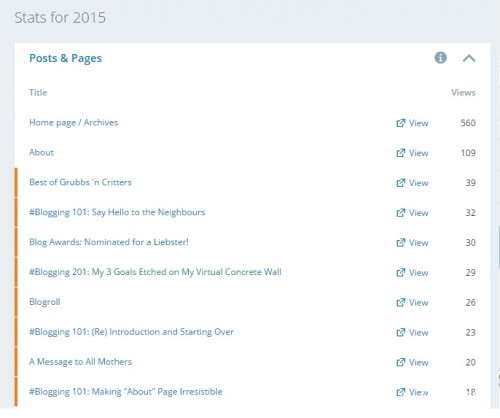
In the last month, the top 10 topics that made to the highest views were those related to Blogging-101. I am also pleasantly surprised that “Best of Grubbs ‘n Critters” made it to the top 3 – which seems to suggest that doing a “Best of” page has been an effective decision.
Is there a pattern in days of week? Looking at past 3 months stats, I think not. Or if there was, I’m not seeing it – because it seems that I get views on the same day that I post at any time of the day – obviously more since Blogging 101. The stats were not crazy high or anything, and it is still too early to conclude anything. However, having hit more than 25 views humbled me.
From a stats perspective,I am glad that people are reading my posts. I can only hypothesize that readers like what they read because, perhaps, I have written it from a perspective of my personal experience on Blogging 101 assignments. If you are seeing what I’m not seeing, I would love to hear your perspectives!

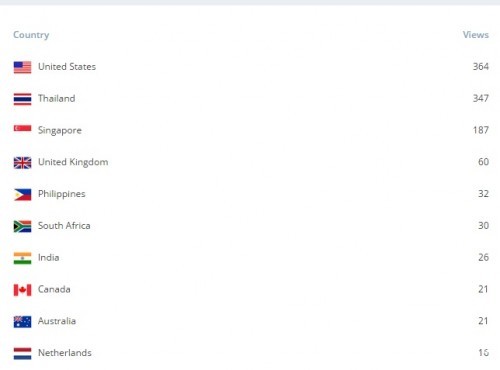
Looking further, I am further humbled that my blog has made some footprints around the world, too! Wooo hoooo! 😀

Where do I go from here? Well, stats would be directional for me and for now, I’m still committed to publish posts every 2-3 days, with a feature of Fabulous Friday Flavour of recipes every Friday.
I’m still learning and experimenting, but I do hope to see you around more often!

Hi, I loved your post on the stats analysis, you’ve written some great stuff – I think I overlooked some aspects of the assignment we had to do. Love your personalized blog, it is absolutely beautiful! Kudos on the great job.
Cheers,
Tx
Thank you for your kind words Thistles & Whistles. It’s great that you found that when you post anything during midnight hours or thereafter, you get more views. That’s more actionable. I couldn’t conclude anything like that so far. But maybe could get more insights in the next few months to come.
Thanks for stopping by! 🙂